How-To
… Embed an Observable Notebook in your CMS
This website shows you how to embed an observable notebook in you usual blog. In this case, we are using Jekyll for the sake of simplicity, but any other CMS would work, as long as it allows you to add some HTML, CSS and JavaScript. It is a direct application of Jeremy Ashkenas’ Downloading and embedding notebooks tutorial.
First, we go to the notebook we want to embed, and decide which named cells we want to show on our blog. In the case of my Tissot’s indicatrix notebook, I want
viewof p and display.
Let’s create an HTML container for each of these cells:
  <p id="viewof-p"></p>
  <div id="display"></div>
Now, we need to find the module URL, which in our case links to https://api.observablehq.com/@fil/tissots-indicatrix.js.

Two options:
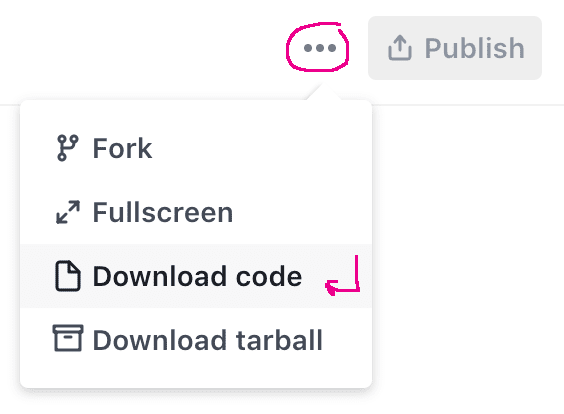
- if this is your notebook, go to the
...menu and click “Download code”. If there is no such option, you will first need to share or to publish the notebook. - if this is not your notebook, you will probably have to fork it, then share the fork (no need to publish it), and the menu will appear.
Our next step is to run this code — technically, an ES module — with the Observable Runtime:
<script type="module">
  import notebook from "https://api.observablehq.com/@fil/tissots-indicatrix.js";

  const renders = {
    "viewof p": "#viewof-p",
    "display": "#display",
  };

  import {Inspector, Runtime} from "https://unpkg.com/@observablehq/notebook-runtime@2?module";
  for (let i in renders)
    renders[i] = document.querySelector(renders[i]);

  Runtime.load(notebook, (variable) => {
    if (renders[variable.name])
      return new Inspector(renders[variable.name]);
  });
</script>
If we stop here, we see that the chart is off, because it’s been computed for a full width, but its container is constrained by the layout of the page in our CMS template.
Let’s add some css for this type of full-width cells:
<style>
/* https://css-tricks.com/full-width-containers-limited-width-parents/ */
.fullwidth {
  width: 100vw;
  position: relative;
  left: 50%;
  right: 50%;
  margin-left: -50vw;
  margin-right: -50vw;
}
</style>
Update the HTML:
<p id="viewof-p"></p>
<div class="fullwidth">
  <div id="display"></div>
</div>
et voilà:
Tissot’s indicatrix
Note: in practice, we use a bit more boilerplate code, which will generate the markup from a list of renders. View source or click on “Code” to grab it.
The other posts on this site demonstrate various examples and techniques, as well as a more detailed boilerplate. Have fun!
Posts
-
UMAP in Aframe
-
Aframe test
-
Aframe GeoJSON test
-
Circular Binary Logarithms
-
Overpass
-
tf-tsne
-
Histograms
-
Tissot’s indicatrix
-
Fisheye
-
Video contouring
-
Breakout
-
Vega Embed
subscribe via RSS